← Back to product EDA that shapes the product

Grant risks show up in many ways before becoming compliance failures.

Close-up of a tall stack of receipts, invoices, and paperwork; details are not readable.
Data sources

Grounded in public grant, policy, and audit history

We combine structured grant metadata, regulatory text, and historical audit outcomes so models and rules stay tied to defensible sources.

  • NIH RePORTER

    Project attributes, budgets, institutions, and scientific themes for NIH-funded work.

  • Code of Federal Regulations (CFR)

    Federal rulebook context for allowable cost principles and uniform guidance foundations.

  • OMB Research & Development (R&D) Compliance Supplement

    Guidance on internal controls and audit procedures tailored to research environments.

  • NIH Grants Policy Statement (GPS)

    NIH-specific compliance expectations that layer on top of broader federal rules.

  • Federal Audit Clearinghouse (FAC)

    Historical single audit submissions, questioned costs, and corrective actions.

Exploratory analysis · FAC

What Federal Audit Clearinghouse history implies for product scope

These figures summarize patterns we extracted from historical single-audit submissions and related regulatory references. They are why complyraAI emphasizes cash-management and grant-level risk alongside transaction review.

Regulatory citations in FAC findings

The plot summarizes audit findings by the regulation cited in each finding. The purple segments correspond to cost principles (allowability rules). They are a relatively small share of the total.

That distribution told us historical noncompliance is not dominated by narrow cost-allowability disputes. We deliberately expanded the product beyond transaction-only allowability inference into cash controls, grant context, and sponsor-specific risk.
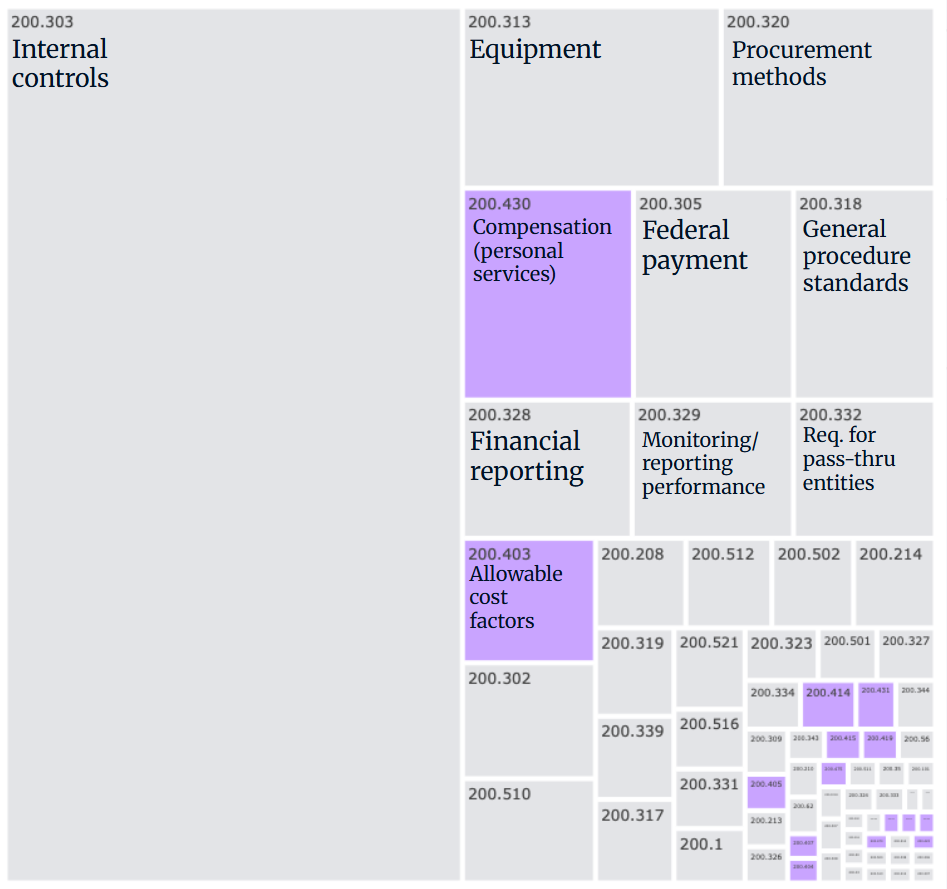
Stacked or grouped chart of FAC audit findings by cited regulation; purple highlights segments tied to federal cost principles.

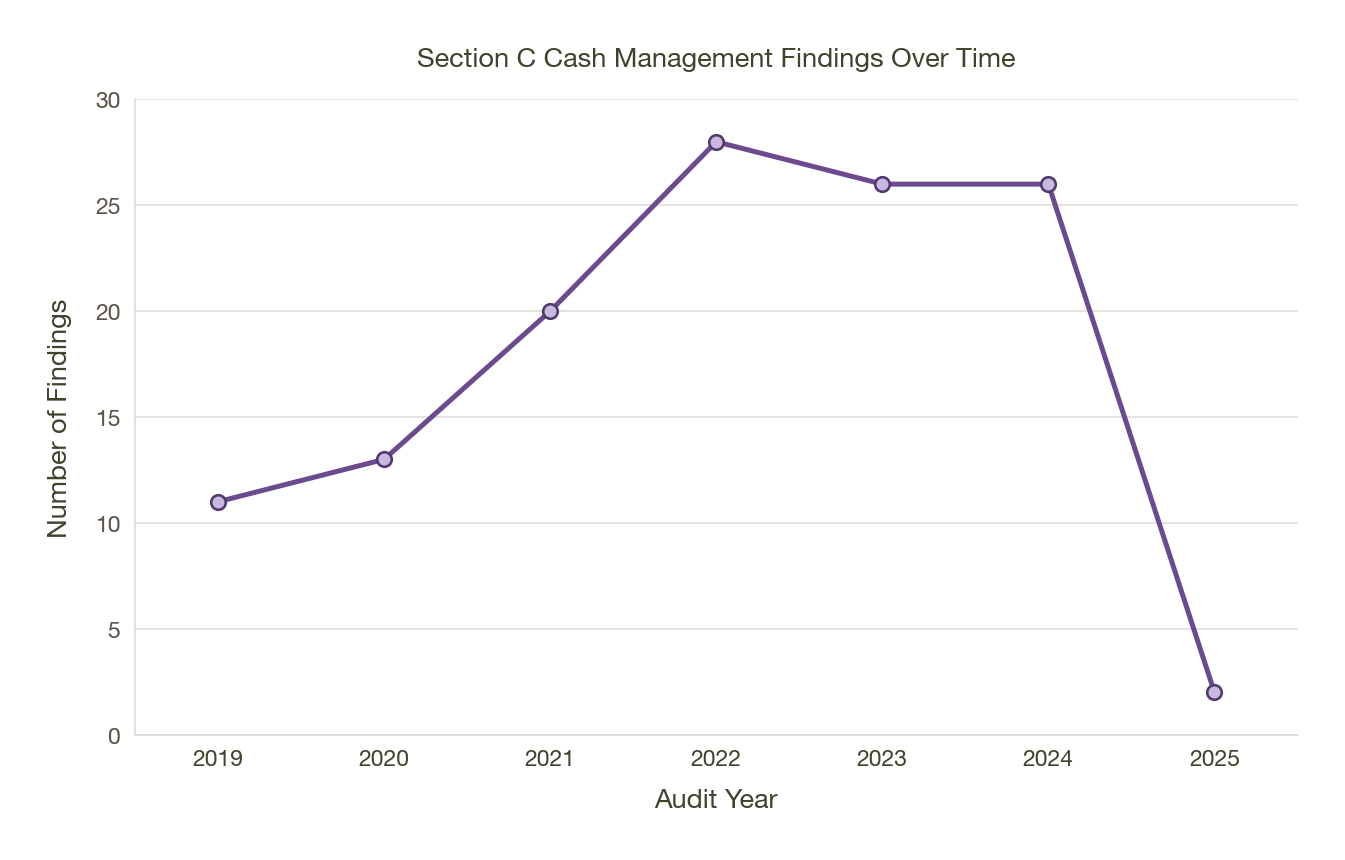
Section C cash management findings over time

We tabulated Section C cash-management findings from the FAC across audit years. Counts rise steadily through 2022–2024, then dip in 2025.

The 2025 drop is more consistent with reporting lag in how submissions appear in the clearinghouse than with a sudden improvement in practice).

Time series of Section C cash management finding counts by audit year, rising through 2024 then declining in 2025.

Section C finding types are control problems, not typos

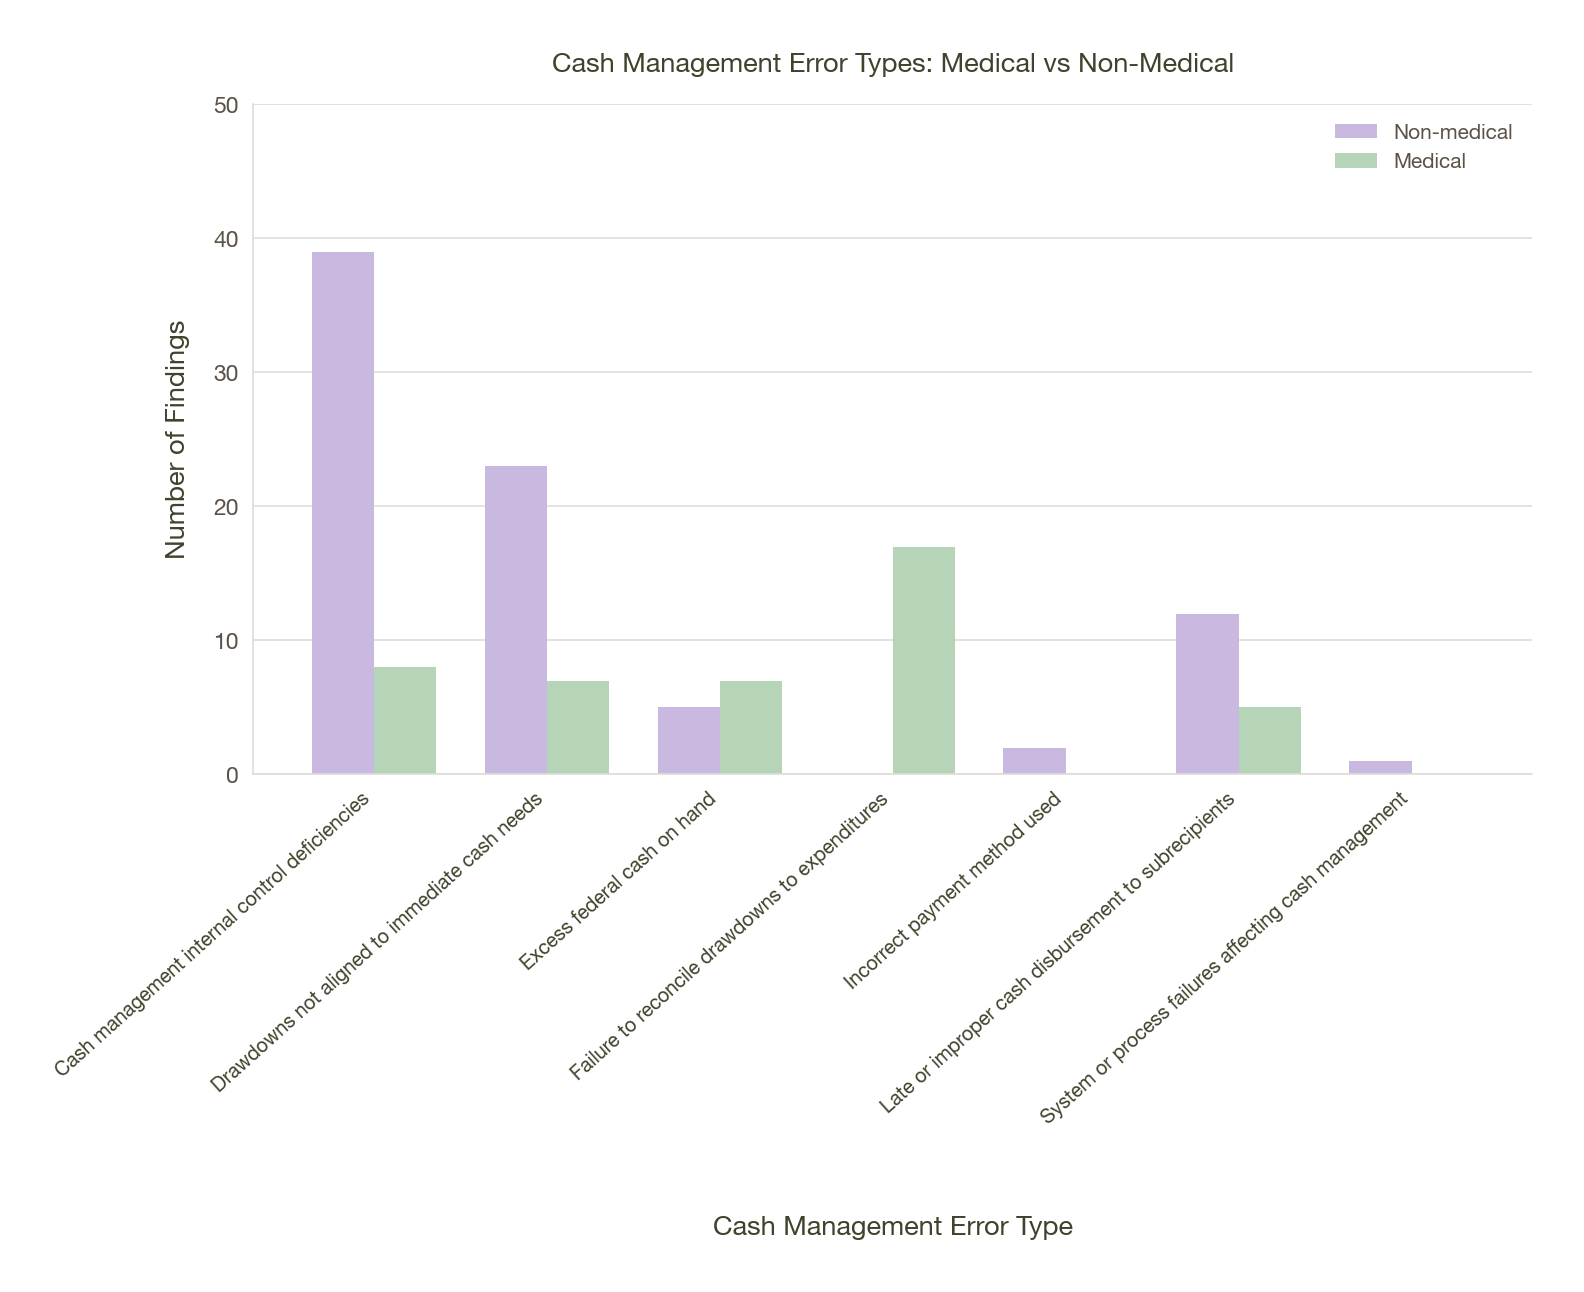
Breaking out Section C cash-management types shows failures are not mainly clerical mistakes (late filings, typos). They are process and control weaknesses in how organizations time, track, reconcile, and justify drawdowns of cash.

Medical-research grant recipients show a higher concentration of drawdown timing and reconciliation issues, which lines up with heavier transaction volume, complex subawards, and accelerated spending cycles.

Grouped bar chart: non-medical findings in lavender and medical findings in mint, by Section C cash management error type.

Material weaknesses in cash management

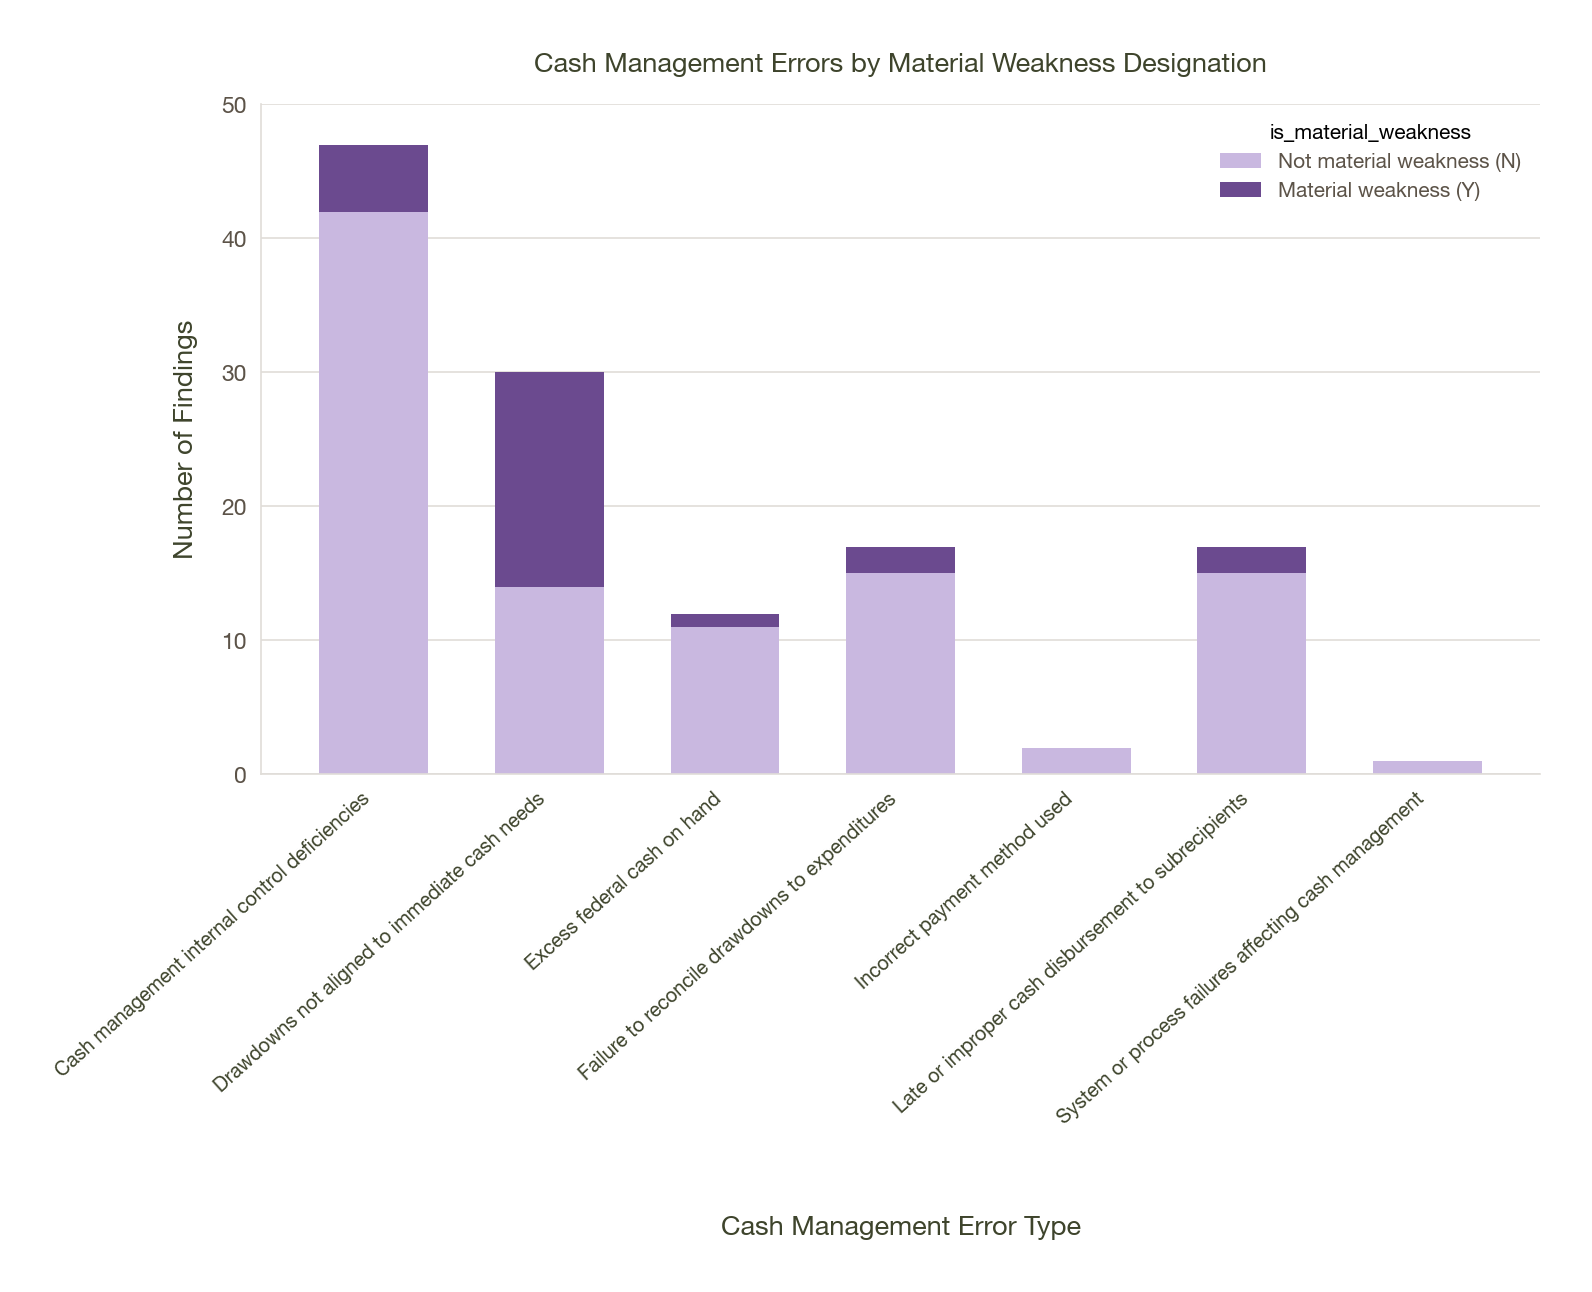
A substantial portion of these cash-management issues are classified as material weaknesses- which means the control environment cannot be relied on to prevent or detect misuse of federal funds.

Stacked bar chart: lavender segments are not material weakness; purple segments are material weakness, by cash management error type.