← Back to Data & Research Technical Overview

Ledger and grant risk—modeled, benchmarked, and scored.

Team at a table with laptops and documents, suggesting grant administration, budgets, and sponsored research oversight.
Ledger Transaction Audit Module

Allowability modeling and how we evaluated it

Modeling: Ledger Transaction Audit Module

Under the hood, the Ledger Transaction Audit Module is powered by a multiclass classifier based on a BERT-style model. The input consists of the vendor, transaction type, and description from an individual expense. The BERT model encodes this text into embedding feature vectors, and uses a sequence of fully-connected layers to determine the most probable class. This output maps to either “No Violation” or a specific section of the CFR rules that the line item is at risk of violating.

During development, we experimented with three base embedding models. Our baseline, MiniLM, is a task-agnostic sentence encoder. LegalBERT and FinBERT are BERT models that were trained on legal and financial data, respectively. In addition, we experimented with introducing a weighting scheme into the cross-entropy loss function, with weights inversely proportional to class frequency so the model pays more attention to under-represented classes.
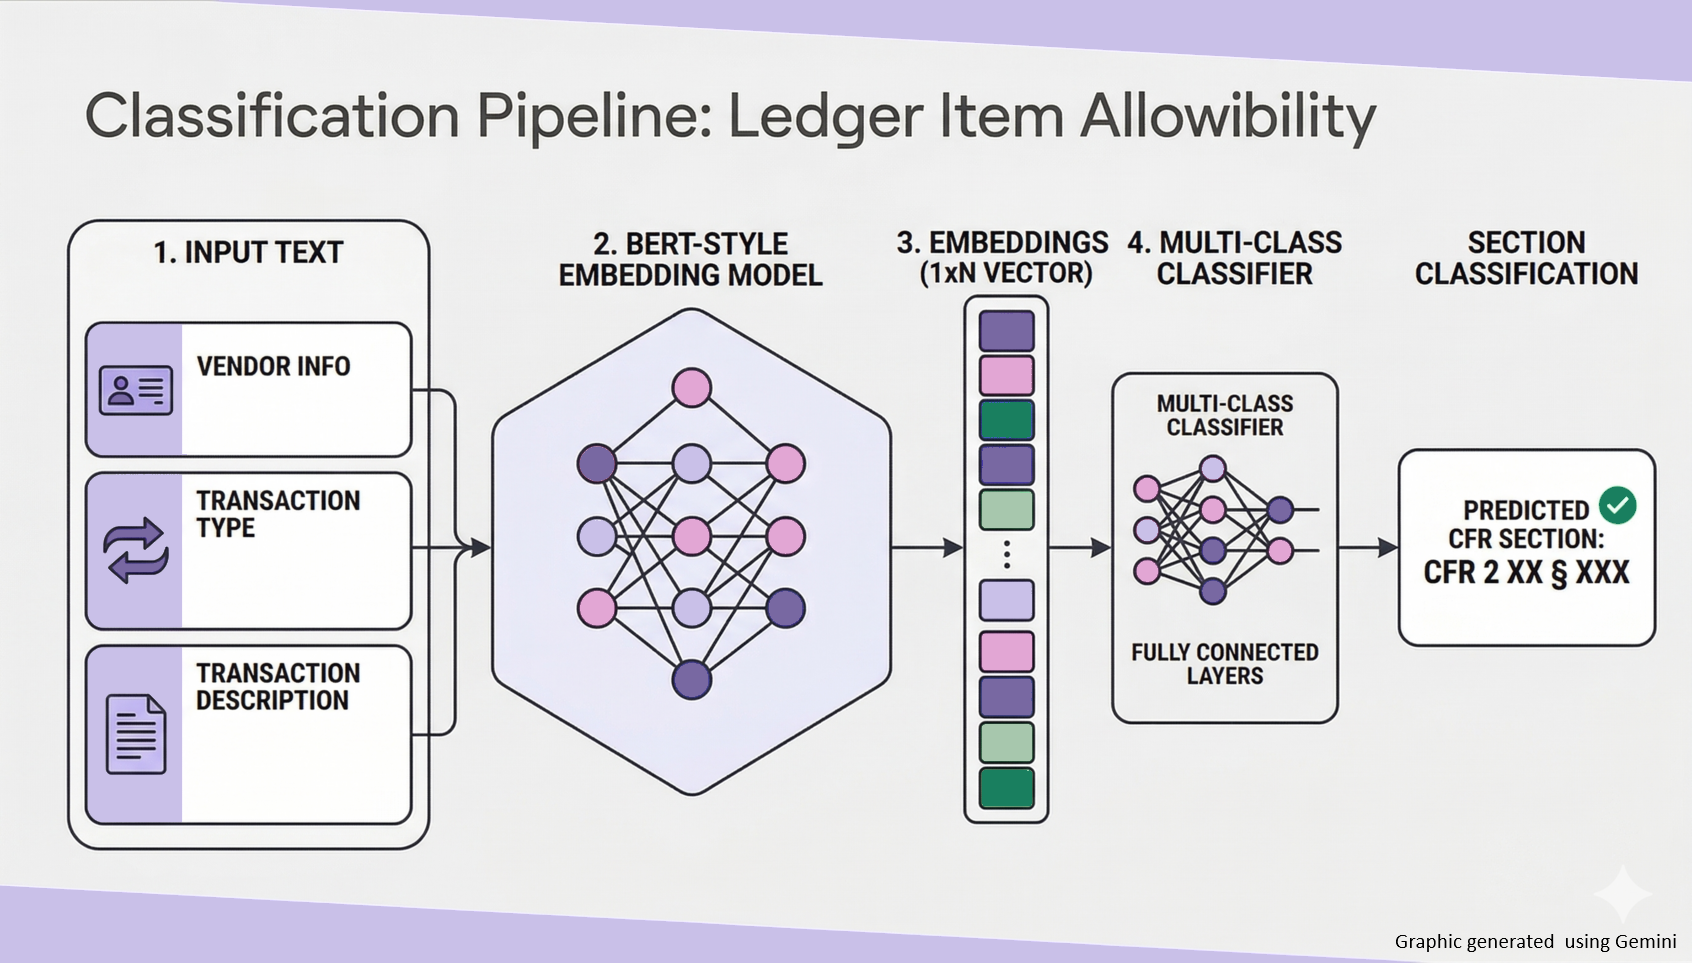
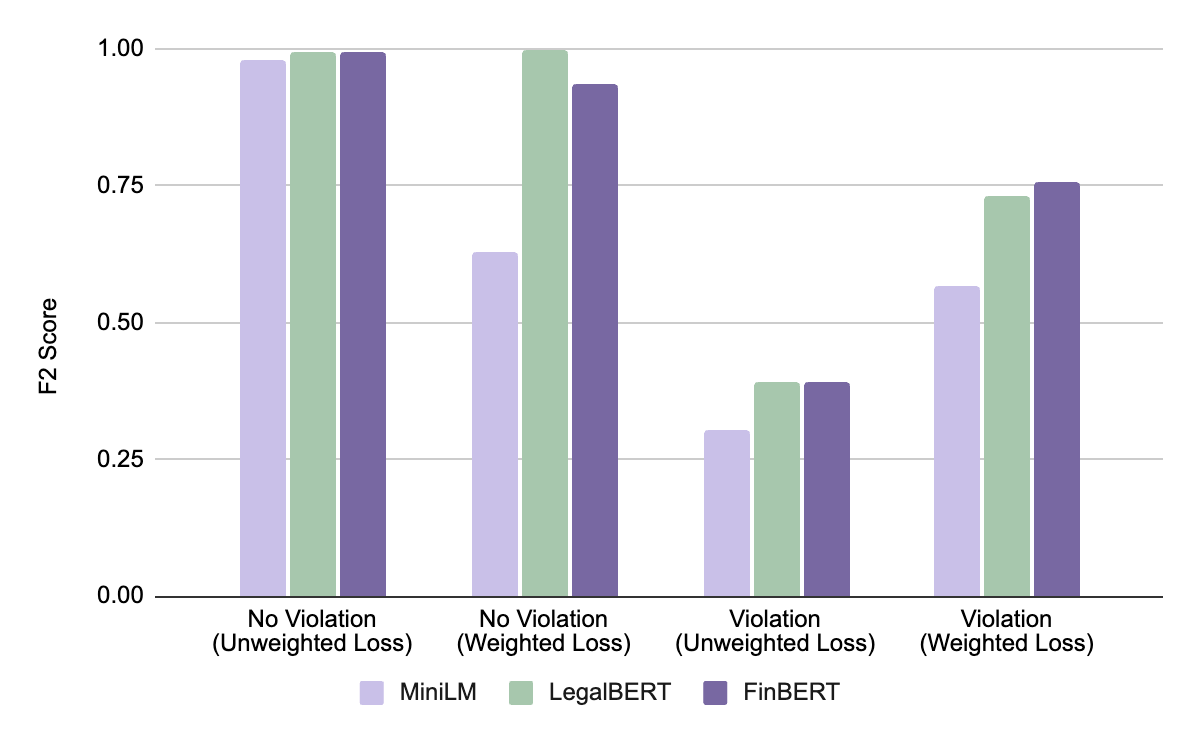
Diagram of the ledger allowability pipeline: expense fields are encoded by a BERT-style model, then passed through fully-connected layers to predict no violation or a CFR violation class.

Evaluation: Ledger Transaction Audit Module

The key evaluation metric for the module was F2 score, which penalizes false negatives more heavily than false positives, meaning we focus on minimizing missed noncompliance risks rather than false alarms. The bar graph shows a comparison of the test set F2 score for our experimental cases. The left two bar groups show the results for the “No Violation” class and the right two for the violation classes, for both the unweighted and weighted loss cases. For our application, performance over the true violations is most important, and the weighted models perform best in this regard. In particular, the weighted FinBERT model has the strongest performance, with an F2 score of 0.76. This is the model that powers our MVP.

The model does still struggle with over-predicting the more common violation classes. To address this, in the future we’d like to explore further sampling and weighting schemes or data augmentation.

Bar chart of test F2 scores comparing MiniLM, LegalBERT, and FinBERT under unweighted and class-weighted cross-entropy, split between No Violation and violation classes.
Grant Risk Profiler Module

Grant Risk Profiler Architecture

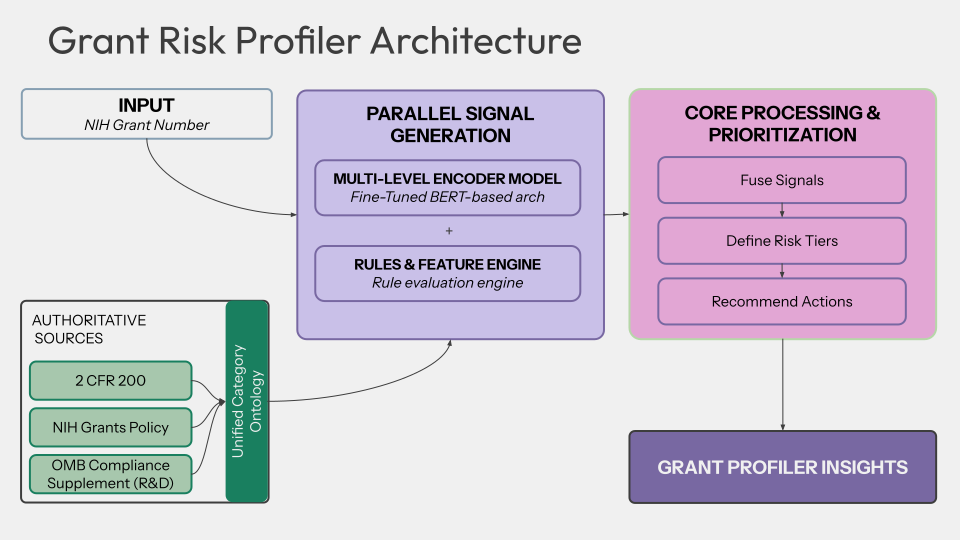
The profiler combines an NIH grant identifier with reference material mapped through a unified category ontology. A fine-tuned BERT-style encoder and a rules-and-feature engine run in parallel; downstream steps fuse signals, assign risk tiers, and surface recommended actions as grant profiler insights.

Architecture overview

Authoritative sources—including 2 CFR 200, NIH Grants Policy, and the OMB Compliance Supplement (R&D)—feed a single ontology that aligns categories across regulations. That structured context meets transaction-level grant input in parallel signal generation before core processing prioritizes what reviewers should see first.

Grant Risk Profiler Architecture diagram: NIH grant number flows into parallel signal generation alongside authoritative sources (2 CFR 200, NIH Grants Policy, OMB Compliance Supplement R&D) feeding a Unified Category Ontology. Parallel generation combines a multi-level fine-tuned BERT encoder with a rules and feature engine. Core processing fuses signals, defines risk tiers, and recommends actions, leading to Grant Profiler Insights output.

Multilabel classifiers on grant NLP

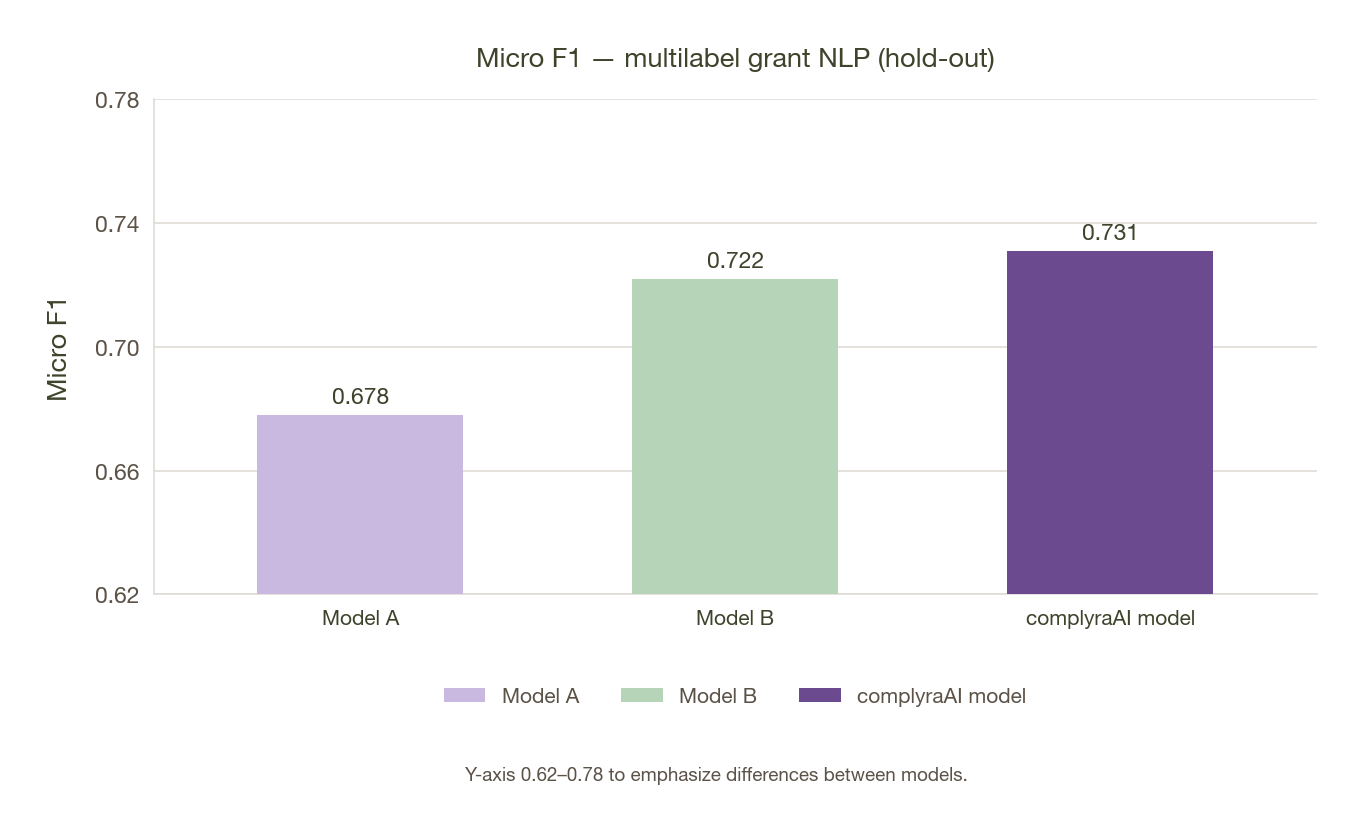
Comparison of three multilabel models on grant text: architecture, runtime, and Micro F1 on a held-out split.
Feature Model A Model B complyraAI model
Architecture deBERTa-v3-small + sigmoid multi-label head TF-IDF + one-vs-rest logistic regression DistilRoBERTa + sigmoid multi-label head
Runtime GPU CPU GPU
Micro F1 0.678 0.722 0.731

Eval: 200-example holdout split; metrics restricted to labels with ≥1 positive on a 796-example train split.

Micro F1 = pooled F1 over all grant×label decisions.

Bar chart of Micro F1 on a hold-out split with y-axis from 0.62 to 0.78: Model A 0.678, Model B 0.722, complyraAI model 0.731. Legend uses lavender, green, and purple bar colors.